Learner Projects
Food Poverty Project Spotlight
Research and data analysis of food poverty in recent years (2015 - 2022)
Data Accelerator Course, Cohort January - May 2022
Learner Projects
Research and data analysis of food poverty in recent years (2015 - 2022)
Data Accelerator Course, Cohort January - May 2022
In January 2022, writer and activist Jack Monroe highlighted flaws in the data used to calculate inflation.
Compelled by the worsening cost of living crisis, our learners launched an investigation into the reality of food poverty in Scotland.
This time last year, the cheapest pasta in my local supermarket (one of the Big Four), was 29p for 500g. Today it’s 70p. That’s a 141% price increase as it hits the poorest and most vulnerable households.
— Jack Monroe (@BootstrapCook) January 19, 2022
This project investigates the factors behind food poverty in the UK and local communities by looking at data from local charities in Scotland, as well as nation-wide data from the UK and the Scottish government.
Conducting multi-layered research across charitable and governmental organisations, their findings demonstrate the dangers of data bias & the true cost of the crisis.
Data from local charities and governmental organisations were searched, including the Clutha Trust, the Trussell Trust, the Food Foundation, Independent Food Aid Network (IFAN), as well as the UK and Scottish Governments and Office for National Statistics (ONS).

The Clutha Trust is an OSCR (Office of the Scottish Charity Regulator) registered charity based in Glasgow that provides services and support for the arts (through groups like CAST, a Clutha Actors Studio Trust – The drama group of the Clutha Trust charity), youth groups, and Food Poverty solutions.

The Trussell Trust was founded in Bulgaria in 1997 based on a legacy left by Betty Trussell. It supports a nationwide network of food banks and together they provide emergency food and support to people locked in poverty, and campaign for change to end the need for food banks in the UK.

The Food foundation was founded in 2014 by Laura Sandy as an independent policy think tank to challenge the current food system and how it was impacting public health.
The charity's vision is a sustainable food system which delivers health and wellbeing for all.

IFAN is a UK network of independent food aid providers. Numerous charities are referring to the data hub and quantitative research undertaken by IFAN. Charity statement: "Our vision is of a country without the need for charitable food aid where adequate and nutritious food is affordable to all".
The main question at the core of this study was: Is the data established by governmental bodies matching the reality and insight claimed by third sector groups and individuals and what are the main parameters relating to the current Food Poverty crisis?
Download full report hereFrom 2019 to 2020, the number of emergency food parcels distributed by 83 independent food banks rose by
In 2021
of individuals reported an increase in their cost of living

In 2019 - 2020, 25% of all children lived in households with marginal, low, or very low food security. This rises to 50% for those in absolute poverty and 51% for those in relative poverty.
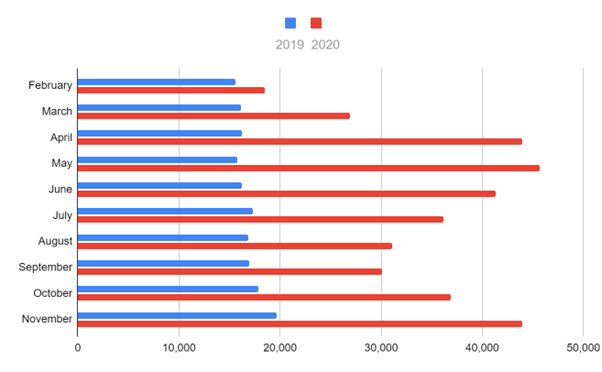
Number of 3-day parcels distributed by 83 independent food banks in the UK, Feb to Nov 2019 and 2020. This clearly demonstrates the increase in food distribution. One of the main reasons attributed to the dramatic UK-wide increase during this period is in relation to the Covid-19 pandemic.
"We faced a number of challenges during the project life cycle, it was never an easy ride working on a project as complex as this and remotely. At first there was a challenge of collecting the real-world datasets and then the reliability of the data itself due to the bias factor of COVID19 pandemic and the lack of data. Then there were the challenges of transforming, cleaning, and modelling the data for the required information. l used Python and Excel for this part of the data analysis process, and for the Data Visualisation, Charts and the Project Dashboard creation part I used Pandas, Excel, and Power BI, all the skills learnt during the course, in collaboration with my team."
The main conclusion of the report is that there is a confirmed rise in Food Poverty over the years as recorded by Third Sector groups and governmental departments.
The project utilised Power BI to bring interactive data visualisations and make data more accessible to all
"The team project was the final part of the Data Accelator course and was the perfect opportunity to put the Data Analysis skills we have acquired into practice. It was an excellent team work experience and we received great support throughout our research and analysis journey on the topic of food poverty."
"The project provided me an excellent opportunity to gain hands on practical experience of working with the real-world data. A practical experience of working within a team, a remote working, collaborating, communicating with members of the team through Slack channels and SpatialChat group meetings, as well as emailing some of the potential dataset suppliers."
"This project gave me a brilliant opportunity to apply what I have learned during the past months of training. Working within a group setting was very exciting and effective. We discovered and employed each other's skills and experience well. I participated in coordination and communication, reviewing and finalising ideas, organising the final report, and creating the visuals and illustrations designing to reflect the data analysis done."
At Code Division we help our learners build a portfolio of their work to showcase their skills and achievements.
We challenge our learners to work on socially-responsible topics, which shed light on current issues and bring them into focus using data.